Best Data Analyst Course in Jaipur
Key Benefits
Get personalized guidance on our Pay After Placement programs
Is Data Analyst Course Right For You?
No matter your background, if you see yourself here - this course is designed for you!
College Students
Final year or recent graduate
Your Challenges:
- •No real-world project experience
- •Confused about career path
- •Theory knowledge but no practical skills
Your Outcome:
Land your first Data Analyst job with real portfolio
Working Professionals
From non-tech backgrounds (CA, MBA, Operations)
Your Challenges:
- •Want to transition to analytics
- •Limited coding knowledge
- •Need to upskill while working
Your Outcome:
Switch to high-paying Data Analytics career
Job Seekers
Freshers struggling to get interviews
Your Challenges:
- •Resume gets rejected
- •No interview calls
- •Don't know what companies want
Your Outcome:
Get guaranteed interview opportunities
Excel Power Users
Already work with data but manually
Your Challenges:
- •Spending hours on repetitive tasks
- •Want to automate and scale
- •Know Excel but need Python/SQL
Your Outcome:
10x your productivity with automation
Don't see yourself here? 🤔
No worries! Our courses are designed for anyone motivated to learn. If you're committed, we'll guide you from zero to job-ready!
Your 16-week Data Analysis journey
Clear modules for career switchers — 2 + 5 + 4 + 5 weeks = 16 weeks total.
16-week learning path
Tap a module to see full curriculum, projects & outcomes
Aptitude training runs in parallel all 16 weeks
What you'll learn
Outcome
Build a strong statistical foundation for analytics decisions
Curriculum breakdown
Foundations of Statistics
- ·Statistics in Data Analytics
- ·Types of Statistics
- ·Population & Sample
- ·Sampling Techniques
Data Visualization & Distribution
- ·Frequency Distribution
- ·Graphical Representation
- ·Bar Charts & Histograms
Descriptive Statistics
- ·Mean
- ·Median
- ·Mode
Measures of Spread
- ·Range
- ·Variance
- ·Standard Deviation
- ·Percentiles & Quartiles
- ·Interquartile Range (IQR)
Outlier Analysis
- ·Five Number Summary
- ·Box & Whisker Plot
- ·Outlier Detection
- ·Anomaly vs Outlier
Correlation Analysis
- ·Correlation Concepts
- ·Correlation Coefficient
- ·Correlation vs Causation
Hands-on projects
- Statistical profiling of a business dataset
Aptitude & interview prep
Quantitative aptitude, logical reasoning, verbal ability, mock interviews, and resume building — alongside your technical modules.
Support for career switchers
Built for beginners with no tech background
Start from Absolute Zero
Step-by-step from basics.
Beginner-Friendly
Simple language, not jargon.
Doubt Resolution
Discord + weekly live sessions.
Flexible Schedule
Recordings for working professionals.
Peer Community
Learn with a supportive cohort.
Career Support
Aptitude, resume, mocks, referrals.
Ready to start your transition?
No coding experience required · Cohorts filling now
Data Analyst Course Curriculum
Our data analysis courses in Jaipur cover a comprehensive learning path designed by industry experts to take you from beginner to job-ready professional
What You'll Learn
Data Analyst Course modules with hands-on projects
Ideal for These Roles
This comprehensive program is designed for professionals and aspiring analysts who want to master data analytics
Aspiring data analysts looking to build expertise in data analysis, visualization, and reporting using industry-standard tools.
Data & insights
Analyze large datasets, identify trends, build dashboards, support data-driven decisions
Management Information Systems professionals seeking to enhance their analytical skills and data-driven decision-making capabilities.
Management reporting & tracking
Prepare periodic reports, monitor KPIs, ensure accurate data for leadership
Business analysts who want to leverage data analytics to provide actionable insights and drive strategic business decisions.
Business problems & solutions
Gather requirements, map processes, coordinate with tech teams, recommend improvements
Real-world capstone projects
Apply your skills to real-world challenges through industry-aligned capstone projects.
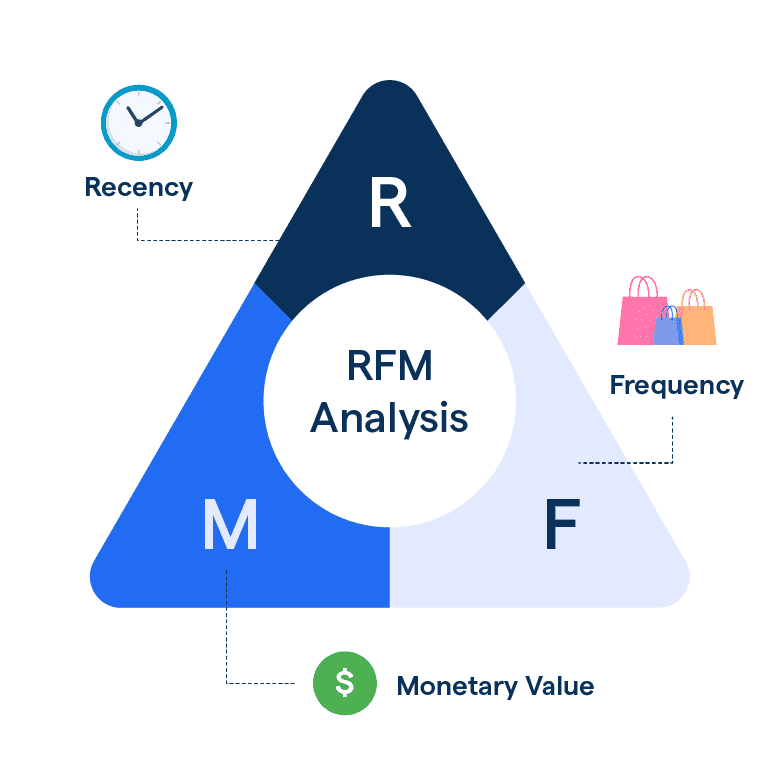
RFM Analysis
RFM analysis is a data-driven marketing technique used to quantitatively evaluate and segment a company's customer base based on their purchasing behavior. It leverages three key metrics to identify a business's most valuable customers and tailor marketing strategies accordingly.
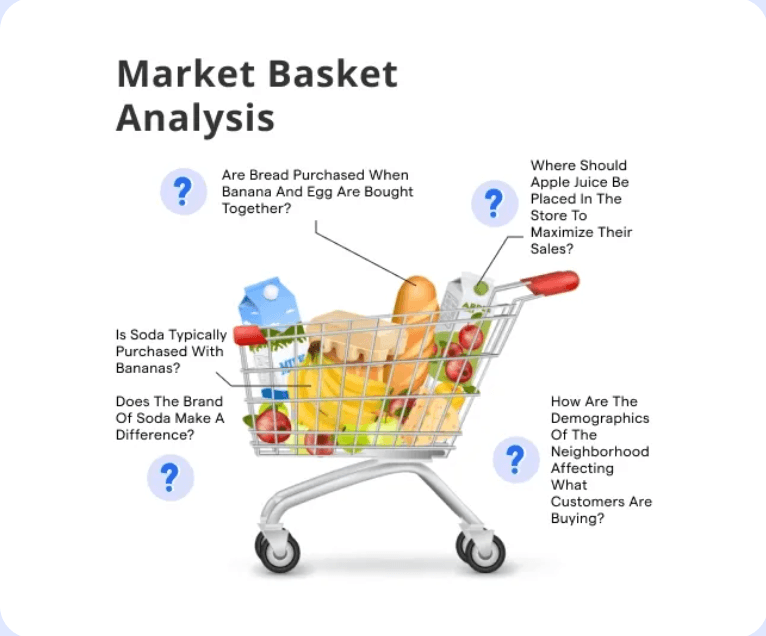
Market Basket Analysis
Market Basket Analysis (MBA) is a data mining technique used to discover patterns of items that customers frequently purchase together. It identifies associations, co-occurring items, and hidden relationships within transaction data. MBA is widely used in retail, e-commerce, and marketing to understand customer buying behavior.
Customer Lifetime Value
Develop an AI-driven chatbot to enhance the EdTech learning experience by assisting students and instructors with academic and administrative tasks.
Gender Guesser
Using Simple Naive Bayes Algorithm predict the gender of a person
Titanic Survival Predicitions
Develop a system focusing on predicting the Remaining Useful Life (RUL) of NASA turbofan engines and detecting performance anomalies using machine learning.
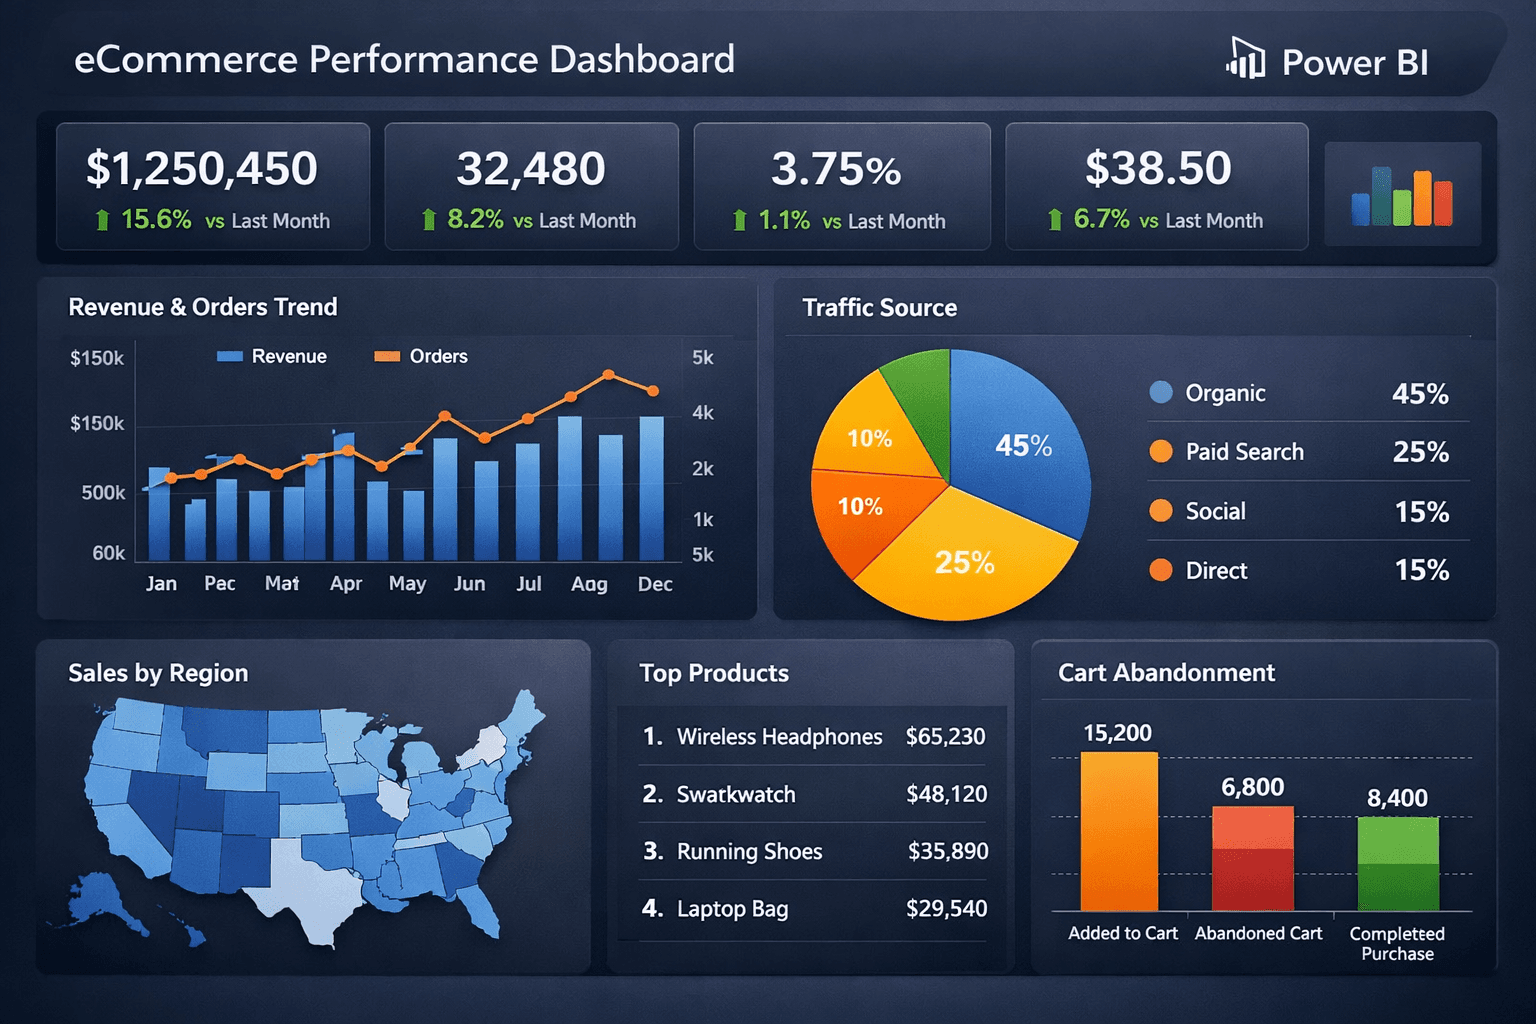
Ecommerce Dashboard
Comprehensive ecommerce analytics dashboard built with Power BI to visualize sales performance, customer behavior, product trends, and revenue metrics. This interactive dashboard enables data-driven decision-making by providing real-time insights into key business KPIs including sales by region, top-performing products, customer segmentation, and revenue forecasting.
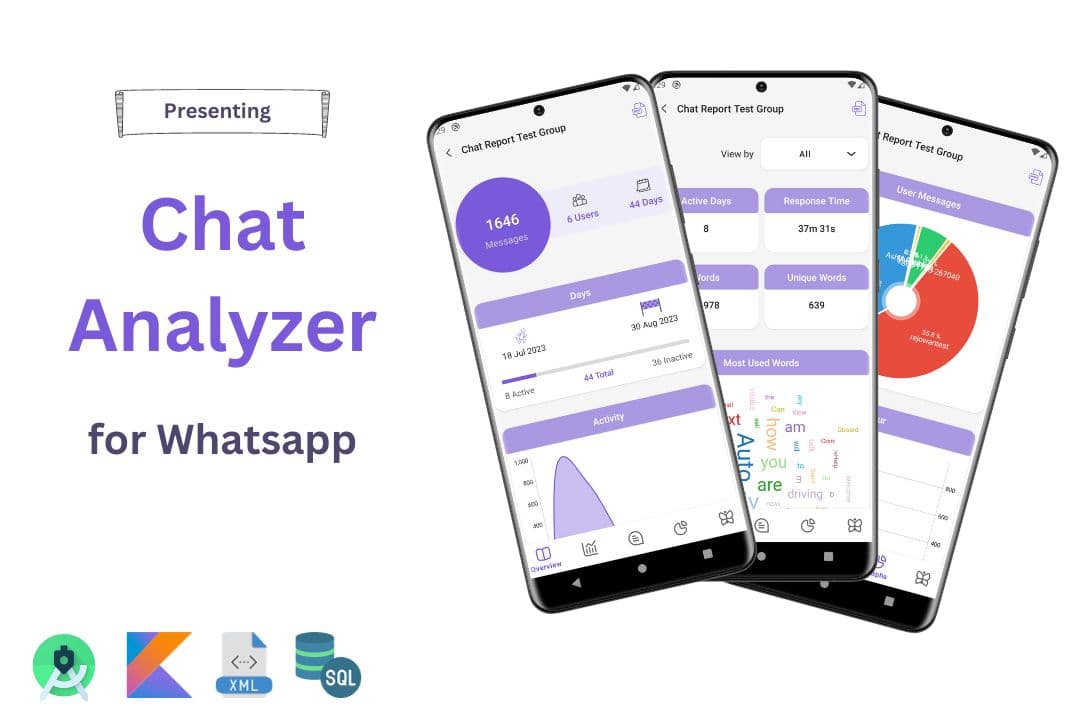
Whatsapp Chat Analyzer
Advanced WhatsApp chat analysis tool built with Python to extract, process, and visualize messaging patterns from exported chat data. This project demonstrates expertise in data extraction, text processing, and exploratory data analysis by analyzing message frequency, active hours, most active participants, word clouds, emoji usage, and conversation sentiment. The analyzer provides comprehensive insights into communication patterns, helping understand group dynamics and messaging behaviors.
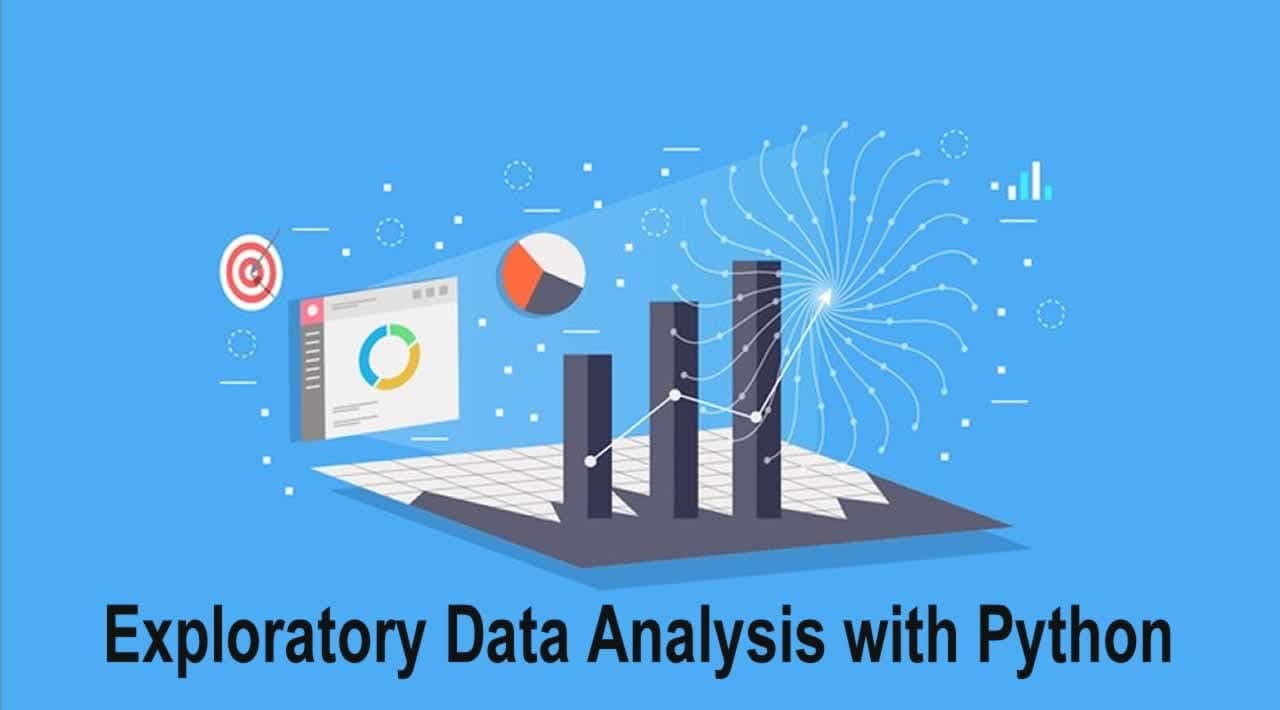
Exploratory Data Analysis
Comprehensive exploratory data analysis project using Python to uncover patterns, relationships, and insights from complex datasets. This project demonstrates proficiency in data cleaning, statistical analysis, and visualization techniques using libraries like Pandas, NumPy, Matplotlib, and Seaborn. The analysis includes handling missing values, detecting outliers, performing univariate and bivariate analysis, correlation analysis, and creating insightful visualizations to understand data distributions, trends, and relationships that drive informed business decisions.
1 of 8
Loading testimonials…
Frequently Asked Questions
Everything you need to know about the Data Analyst Course